Performance » Numeracy » Recommendations for teachers:
Identifying and interpreting data presented in graphs
The next area that many students had difficulties with was identifying and interpreting data presented in graphs.
These types of questions involved identifying information from simple graphs, comparing basic information, and finding differences.
Example question
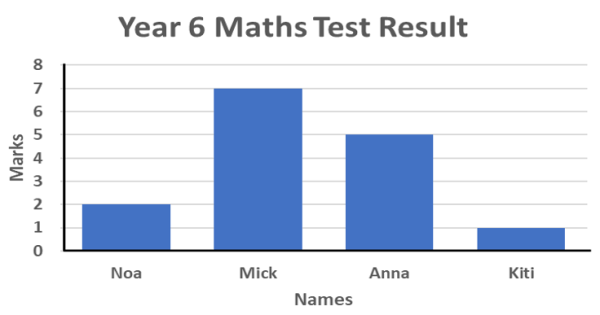
An example of one of these questions and how students responded to it is provided. This question asks students to identify the difference between two values shown with a bar graph.
Figure DEF#3 / Sample question:
Collect, represent and interpret data in a range of graphs and charts.
Question:
The graph below shows the Maths test result for four students. What is the difference between Anna's and Kiti's mark?

Learning outcome:
Identifies and compares everyday information represented in simple graphs, find the difference.
Responses:
4
Possible misconceptions:
- Students are able to describe the difference correctly.
- Students gave a correct number sentence.
Level of difficulty:
We would expect only higher performing Year 4 and Year 6 students to successfully answer this question.
The question item is asked of both Year 4 and Year 6 students.
The question item is on level 6 of the numeracy proficiency descriptors, which is above the minimum level of proficiency expected from Year 4 (level 3) and also Year 6 (level 5).
Performance analysis:
This is a relatively difficult question. This question was above the expected minimum level of numeracy performance for year six students and substantially above the minimum expected performance for year four students.
Only high performing year six students and very high performing year four students were expected to answer this correctly. Only 16% of year four students and 16% of year six students correctly answered this question.
4% of year four students and 6% of year six students were able to partly solve the problem: they correctly described the difference but did not give the number (for example, writing that one value is higher than the other).
There may be a need to support students’ knowledge and interpretation of graphs. This question shows that many students may need support to understand the basic concepts or data being shown in various types of graphs. Others may also need support to accurately describe the information being presented.
How can teachers support learning in this area?
Addressing how these types of questions are taught in schools may increase student performance in future. Below, SPC present some ways that teachers might support learning in this area.
- Teachers may use grounded and fun techniques to elicit student interest and understanding such as the ‘Guided Practice’ approach. In this approach, students can be asked to come up with fun things that they can compare heights with or, if none are given by students, the teacher makes some suggestions. The teacher then moves discussions to the bar graph concept using examples from the discussion with the children quantifying the comparisons.
- Give students hands on activities from collecting data, representing data on the bar graph, and interpreting data by quantifying responses.


